


Richard A Lawhern PhD, Stephen E Nadeau MD, and Jay Joshi, MD
ABSTRACT
This paper provides an analysis of relationships between prescribing for opioid analgesics in acute and chronic pain, versus drug overdose mortality in which a prescription opioid is identified as a contributing cause of death. Data reported in the US National Cause of Death database support the finding that opioid analgesics prescribed by responsible clinicians have contributed only marginally to drug related mortality in years from 2000 to 2020.
When US National statistics are dis-aggregated to reveal State by State relationships, opioid prescribing rates are shown to have no consistent cause-and-effect association with deaths attributed to prescription drugs. The contribution of prescription opioids to the US opioid crisis is effectively “lost in the noise” of street drugs – particularly Heroin and illicit Fentanyl.
DISCUSSION
This paper amplifies on the background and references of a podcast interview published by the authors in December 2023 [1].
From 2010 to 2016, the US Centers for Disease Control and Prevention (CDC) claimed that rising numbers of drug overdose deaths were dominated by doctors over-prescribing opioid analgesics to their patients [2]. CDC responded to this “crisis” in 2016 and again in 2022 with clinical prescribing guidelines that advocated for restrictions on the availability of prescription opioid analgesics to patients [3] [4].
The US Drug Enforcement Administration has pursued a wide-ranging campaign of prosecutions against clinicians who prescribe opioids [5]. A key assumption of both the CDC guidelines and DEA policy is that there is some known threshold of opioid dose or duration above which the clinical use of opioid analgesics leads to high risk of drug dependency and iatrogenic addiction — and is therefore outside “usual and customary medical practice.” However, as demonstrated in data published by the US CDC itself, the National Institute on Drug Abuse, National Vital Statistics System and others, this assumption is fundamentally incorrect on basic science. [6]
The present paper compares rates of opioid prescribing versus rates of accidental overdose mortality in which prescription opioids are identified as contributors, both nationally and by US State. Two primary data sources are employed. The first source is data downloaded by other investigators and reported in a seminal paper published in the prestigious journal Science in 2018 [7].
The second source is a series of data downloads from the US National Cause of Death Database, accessed via the CDC-Wonder database interface [8] [9]. A short paper was published in 2018, abstracting from this source data [10]. Further CDC data downloads were conducted during December 2023, to assess the impact of changes in attribution of deaths related to Fentanyl, initiated by the CDC in 2018 [11]. Results have been cross-checked against data files downloaded by a third investigator in January 2023 from the National Institute on Drug Abuse [12].
The overall character of the data and trends in these sources supports a central observation. Prescription opioids have been implicated in rising accidental drug overdose mortality since 2010. However, prescription opioids are only one of seven factors in a complex and dynamic process. When deaths involving prescription opioids as one factor among others are compared to rates of prescribing on a State-by-State basis, trend lines in recent years are flat, with no statistically significant correlation between the two. There is no cause-and-effect relationship between prescribing rates versus deaths in which a prescription opioid is one of the contributing factors.
Analysis of Jalal et al.
In 2018, a group of investigators headed by Hawre Jalal downloaded and analyzed cause of death data in nearly 600,000 US deaths attributed to accidental drug overdoses of all kinds for 1979 to 2016 [7]. Figure 1 below is taken directly from their paper in Science.
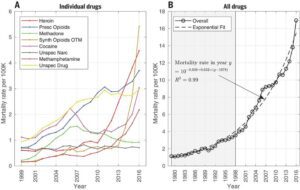
Figure 1: Mortality Rates from Unintentional Overdoses (Jalal et al).
The paper by Jalal et al identified the “National Vital Statistics System” as the source of these data and referred to the cause of death classification framework of the tenth edition of the International Classification of Diseases (ICD-10). However, specific ICD codes were not named for component contributors identified at the left side of Figure 1.
Jalal et al found that at US National level, year-by-year from 1999 to 2016, unspecified narcotics and other unspecified drugs were identified in about 20 to 25% of all drug related mortality reports attributed to accidental poisoning by drugs. The two sub-categories represent uncertainties in assignment of cause of death on the part of County Coroners and Medical Examiners. Part of this uncertainty also results from frequent deaths in which two or more drugs plus alcohol are found in postmortem blood toxicity screens or are otherwise indicated in evidence collected at the scene of death or extracted from State Prescription Drug Monitoring Programs. Also compounding uncertainty is the increasing prevalence of illicit Fentanyl in counterfeit pills sold in street markets.
In 2016, reports of Cocaine and Methamphetamine poisoning appeared in 30% of accidental drug overdose mortality reports. Deaths involving Methamphetamine dipped significantly between 2008 and 2013, before resuming a sharp upward trend.
According to the US Drug Enforcement Administration, “synthetic opioids other than Methadone” include Tramadol, Fentanyl, and chemical analogs of Fentanyl (alpha-methylfentanyl, 3-methylthiofentanyl, acetyl-alpha-methylfentanyl, beta-hydroxy-3-methylfentanyl,alpha-methylthiofentanyl, thiofentanyl, beta-hydroxyfentanyl, para-fluorofentanyl and 3-methylfentanyl) [16 ].
“US CDC instruction manuals for ICD-10 Mortality” [16] identify over 50 prescription opioid drugs as “synthetic and semi-synthetic” drugs. These include Percodan, Palladone, Oxymorphone, Oxychlorosene, Opioid NEC, Nicomorphine, Morphine it, Morphin, Methylmorphin, Hydromorphone, Hydrocodone, Ethylmorphine, Drocode, Dilaudid, Dihydromorphine, Dihydrohydroxycodeinon, Dihydrocodeinon, Dihydrocodein, Codeine, Antitussive NEC (codeine mixture), Acemorphan, and Vicodin. These drugs are coded primarily in two sub-categories within the T40 class of opioids: natural and semi-synthetic opioid analgesics (T40.2) and synthetic opioid analgesics other than Methadone (T40.4). However, in current calculations of prescription opioid deaths, only category T40.2 and T40.3 (Methadone) are reported as prescription-related [20]. Thus definitions for what drugs comprise “prescriptions” have varied between years and between sources.
Analysis of John Alan Tucker – 2016
In 2016, an interesting graphic was published by a business analyst named John Alan Tucker, on Twitter (since re-named “X”). The graphic compared rates of accidental drug-related mortality to rates of opioid prescribing in each of 50 US States and District of Columbia. [8] Although Dr. Tucker was a business analyst with no previous background in healthcare writing, his interest had been piqued by articles in mass media assigning blame for the ongoing US “opioid crisis” to over-prescribing by doctors to their patients. He downloaded mortality data from the US National Cause of Death Database via the CDC-Wonder interface [13]. He then compared rates for all drug-related mortality for each reporting US State, with rates of opioid prescribing extracted from the National Center for Health Statistics “US Opioid Dispensing Rate Maps”. [14]
Tucker analyzed reports of all drug-related accidental death reports considered to be drug-related in any category – an analysis closely similar to that of Jalal et al. A subsequent analysis focused on more narrowly defined categories and sub-categories:
X42 – accidental poisoning by and exposure to narcotics and psychodysleptics [hallucinogens], not elsewhere classified, for sub-categories T40.0 to T40.4, and T40.6
X62: – intentional self-poisoning by and exposure to narcotics and psychodysleptics
(hallucinogens), not elsewhere classified. Reports in this category turned out to be relatively few in number.
Sub-categories T40.0 -T40.6:
T40.0: Poisoning by Opium (a very small contribution, generally labeled “unreliable” in Multiple Cause of Death database searches)
T40.1: Poisoning by Heroin
T40.2: Poisoning by Other Opioids (ICD code uncertain in Jalal et al)
T40.3: Poisoning by Methadone
T40.4: Poisoning by Other Synthetic Narcotics (noted in Jalal et al as “Drugs OTM”)
T40.5: Poisoning by Cocaine
T40.6: Poisoning by Other and Unspecified Narcotics (also noted in Jalal et al)
Figures 2 and 3 are taken from an analysis by Dr Tucker posted to social media in April 2018 [9]. These data were later incorporated in a published article [10]
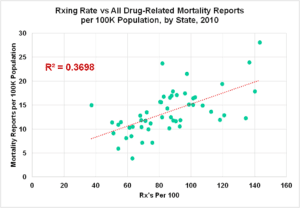
Figure 2: All Drug-Related Mortality vs. Opioid Prescribing Rates
by State, 2016 – ICD-10 Codes T40.0-T40.6
[Data Downloaded April 2017]
In this graphic, there is a general upward trend in drug related mortality between States, as prescribing rates increase. However, the variance accounted for (R-squared) is well below the range generally accepted as indicative of a possible cause and effect relationship.
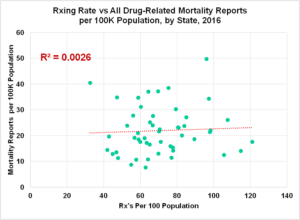
Figure 3: All Drug-Related Mortality vs. Opioid Prescribing Rates
by State, 2016 – Categories T40.0-T40.6
[Data Downloaded April 2017]
Characteristics of scatter plots changed significantly between 2010 and 2016. Accidental drug-related mortality rates overall nearly doubled as prescribing rates dropped marginally. The wide spread between States continued in both the number of drug-related mortality reports per million and opioid prescribing rates per hundred population. However, there was no evident correlation between the two. 2010 also represented a year in which actions by US States were beginning to shut down pill mills and reduce prescribing to more conscientious clinicians. The flattening of the trend line in 2016 and later is a plausible result.
For 2016, the average rate of mortality linked to drug-related causes across all US States was about 23 death reports per hundred thousand population, with some States indicating as few as eight and others as many as 50 reports per 100 thousand population in that year. Trend lines with increasing prescription rates were flat. Correlation coefficient was miniscule.
Corrections to CDC Drug Overdose Methodology
In the same year as publication of Jalal et al, US CDC acknowledged that incidence of deaths attributed to prescription opioids had been significantly over-reported prior to 2016, due to aggregation of deaths involving illegally manufactured Fentanyl in the same category with “prescription” opioids. When attributions were corrected, the number of deaths attributed to prescription opioids in 2016 dropped from 32,445 to 17,087. Currently, only mortality reports in sub-categories T40.2 and T40.3 are attributed to “prescription” drugs [20].
To evaluate the impact of changes in CDC mortality attribution, several online searches were conducted in December 2023 in the CDC-Wonder database, for Multiple Cause of Death focused on drug poisonings [11]. Figure 4, Figure 5 and Figure 6 below show the State by State “scatter diagrams” generated for 2010, 2016, and 2020 respectively. These charts portray mortality reports per 100,000 population by State, for drug-related categories of mortality, in two sub-categories (T40.2 – Other Opioids and T40.3 – Methadone) that include approximately 50 prescription drugs.
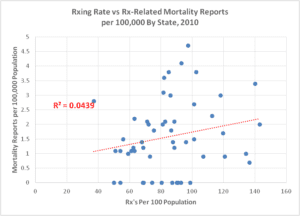
Figure 4: Mortality Reports Involving Prescription Opioids
vs. Prescribing Rates by State, 2010
Categories T40.2 and T40.3
[Accessed December 2023]
Unlike plots of drug overdose-related deaths of all types (Figure 2 and Figure 3), when the focus is narrowed specifically to categories of reports that involve prescription drugs, the trend lines for 2016 and later years are flat to negative and correlation coefficients are miniscule. “Zero” data points in Figure 4 represent States where fewer than 20 deaths involving prescription opioids occurred.
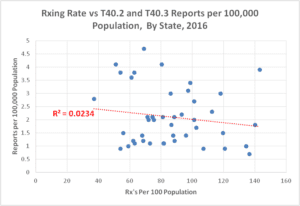
Figure 5: Mortality Reports Involving Prescription Opioids vs.
Prescribing Rates by State, 2016 — Categories T40.2 and T40.3
[Accessed December 2023]
In 2010, all five States where prescription-opioid-related mortality was highest were also States where prescribing rates were near or below the US National average. This trend continued in 2016, even as rates of prescribing overall were reduced.
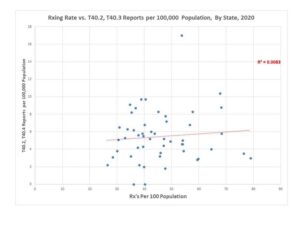
Figure 6: Mortality Reports Involving Prescription Opioids vs.
Prescribing Rates by State, 2020 — Categories T40.2 and T40.3
[Accessed December 2023]
In 2020, four of the five States with highest prescription-opioid-related mortality rates were again near or below the US National average for opioid prescribing rates. Average prescribing rate per 100 population was reduced significantly from 2010.
We should note that Multiple Cause of Death statistics do not report deaths. CDC Multiple Cause of Death databases contain coded reports from death certificates, each of which may contain up to 20 codes for contributing causes of death. As acknowledged by Jalal et al, individual deaths may involve more than one contributing cause and thus generate multiple reports.
A Shifting and Dynamic “Opioid Epidemic”
As noted by Jalal et al, accidental death due to drug overdose is a highly dynamic process. To illuminate these dynamics, several searches were conducted in the CDC-Wonder database for both Nationally aggregated and State-by-State accidental overdose mortality attributed to prescription drugs.
Tables were generated to further explore the top five and bottom five US States ranked by opioid overdose rates (mortality reports per hundred thousand population) versus those ranked by prescribing rates (prescriptions per hundred population). Results for 2010, 2016 and 2020 are shown in Table 1 through Table 3, below.
|
State |
CDC Wonder T40.2, -T40.3 Reports/100K Population | Prescribing Rate #/100 Population |
Population
|
# Reports Total by State
|
| States with Highest Mortality Report Rates, 2010 | ||||
| New Mexico | 3.6 | 81.9 | 2,059,179 | 75 |
| Oklahoma | 3.8 | 102.4 | 3,751,351 | 142 |
| West Virginia | 3.8 | 85 | 1,852,994 | 71 |
| North Carolina | 4.1 | 93.1 | 9,535,483 | 393 |
| Nevada | 4.7 | 97.3 | 2,700,551 | 128 |
| States with Highest Prescribing Rates, 2010 | ||||
| Arkansas | 0.9 | 120.8 | 2,915,918 | 25 |
| Alabama | 1 | 134.3 | 4,779,736 | 50 |
| Louisiana | 0.7 | 136.5 | 4,533,372 | 31 |
| Tennessee | 3.4 | 140 | 6,346,105 | 213 |
| Wisconsin | 2 | 143.1 | 5,686,986 | 111 |
| 0 to 4.7 Reports per 100K Population
|
37 to 143 Prescriptions per 100 Population | 13,057 to 315,168 Prescriptions Per Death | ||
Table 1: Top 5 States Ranked by Mortality and By Prescription Rates, 2010
[Accessed December 2023] [Note1-4]
|
State |
CDC Wonder T40.2, -T40.3 Reports/100K Population | Prescribing Rate #/100 Population |
Population
|
# Reports Total by State
|
| States with Highest Mortality Report Rates, 2016 | ||||
| Rhode Island | 13.9 | 60.3 | 1,331,479 | 147 |
| District of Columbia | 14.7 | 32.5 | 11,614,373 | 100 |
| Ohio | 16.6 | 75.3 | 1,056,426 | 1,926 |
| Massachusetts | 19.1 | 47.1 | 681,170 | 1,303 |
| New Hampshire | 25.8 | 64.3 | 1,831,102 | 344 |
| States with Highest Prescribing Rates, 2016 | ||||
| Louisiana | 2.1 | 98.1 | 4,681,666 | 97 |
| Mississippi | 1.8 | 105.6 | 2,988,726 | 55 |
| Tennessee | 4.7 | 107.5 | 6,651,194 | 311 |
| Arkansas | 1.2 | 114.6 | 2,988,248 | 37 |
| Alabama | 3.1 | 121 | 4,863,300 | 149 |
| 0 to 25.8 Reports per 100K Population | 32-121 Prescriptions per 100 Population | 2,214 to 92,255 Prescriptions Per Death | ||
Table 2: Top 5 States Ranked by Mortality and By Prescription Rates, 2016
[Accessed December 2023] [Note1-4]
|
State |
CDC Wonder T40.2 and T40.3 Reports/100K |
Prescribing Rate #/100 Population |
Population
|
# Reports Total by State
|
| States with Highest Prescription Mortality Report Rates, 2020 | ||||
| District of Columbia (11) | 9.1 | 34.7 | 8,882,371 | 1,720 |
| Maryland (24) | 9.7 | 38.8 | 1,057,125 | 213 |
| New Mexico (35) | 9.7 | 40.4 | 11,693,217 | 2,658 |
| Kentucky (21) | 10.4 | 67.8 | 986,809 | 280 |
| West Virginia (54) | 17 | 53.7 | 712,816 | 222 |
| States with Highest Prescribing Rates, 2020 | ||||
| Kentucky | 10.4 | 67.8 | 4,477,251 | 725 |
| Mississippi | 8.8 | 68.2 | 2,966,786 | 996 |
| Louisiana | 5.8 | 68.3 | 4,645,318 | 335 |
| Arkansas | 3.5 | 76.4 | 3,030,522 | 72 |
| 20Alabama | 3 | 78.9 | 4,921,532 | 290 |
| 0 to 17 Reports per 100K Population | 27 to 79 Prescriptions per 100 Population | 1,114 to 32,157 Prescriptions Per Death | ||
Table 3: Top 5 States Ranked by Mortality and By Prescription Rates, 2020
[Accessed December 2023] [Note1-4]
Note 1: The number of prescriptions per mortality report per year varies across a range of one death per 1,114 prescriptions to one in 315,168 prescriptions. These low incidence levels are generally consistent with findings of multiple demographic studies of the risks of iatrogenic opioid overdose or suicide [21] [22] [23]. However, absolute incidence of prescription-related overdose mortality is so low that it may fall within the range of County Coroner and County Medical Examiner assignment errors in cause of death.
Note 2: The top five States ranked by prescription-related mortality or by prescribing rate are highlighted in gray. Bottom five States ranked by mortality or by prescribing rate are highlighted in green.
Note 3: Mortality reports for all drug-related causes in Sub-Categories T40.2 – Other natural and semi-synthetic opioids and T40.3 – Methadone.
Note 4: Mortality Report rates are returned from CDC-Wonder as “unreliable” (essentially “zero”) from States with fewer than 20 reported deaths in the category.
From 2010 to 2020, prescribing rates overall dropped by 55% even as reports of deaths involving prescription opioids among other factors increased. In all three years analyzed, Arkansas had one of the top five prescribing rates in the US, but was below national average or among the bottom five in prescription opioid related mortality.
Trends and Key Events in Drug Overdose Mortality:
From 2000 to 2018, individual States were establishing Prescription Drug Monitoring Programs (PDMPs) — 27 by 2005, 43 by 2010, and all States except Missouri by 2018 [29]. PDMPs effectively destroyed the business model that had previously allowed some doctors and pharmacists to operate “pill mills,” dispensing large volumes of prescription opioids to street re-sellers.
Prescribing volume rose steadily from 2000 to 2010. However, 2010 can be characterized as a “watershed year” in this process. In both the work of Jalal et al and more recent year-by-year data reported from CDC-Wonder, mortality reports involving prescription opioids [DSM-10 Categories T40.2, T40.3] among other factors, dipped from 2011 to 2014 before continuing to rise sharply thereafter.
In 2010, the US FDA also mandated reformulation of Oxycodone into abuse-resistant form [18] [28]. Prescriptions for Oxycodone were sharply reduced, even as mortality attributed to Heroin rose by over 400% from 2010 to 2016 [7]. Similarly, mortality reports in which synthetic opioids other than Methadone played a part [DSM-10 Category T40.4] increased more than 600% between 2013 and 2016, reflecting the surge in deaths involving illicit Fentanyl.
The US Bureau of Vital Statistics has acknowledged that a majority of opioid drug overdoses from 2010 to 2018 involved illicit Fentanyl rather than prescription opioids administered by clinicians [20]. However, illicit Fentanyl is almost never delivered in prescription Fentanyl patches. It is instead distributed in street markets, in counterfeit pills that are illegally manufactured to closely resemble prescription drugs. Likewise, Naloxone (Buprenorphine Hydrochloride and Naloxone Hydrochloride Dihydrate) prescribing has increased sharply since 2010; however deaths in which Buprenorphrne is a factor are reported in category T40.4.
Following on its admission in 2018 that illicit Fentanyl had caused over-reporting of deaths involving “prescription” opioids, CDC made an effort to refine the definitions of this generic class of drugs. The CDC “State Unintentional Drug Overdose System” (SUDORS) is one such effort [26]. The SUDORS data dashboard defines “prescription drugs” differently than historically [16], by combining data on 21 prescribed drugs with potential for lethality. Table 4 lists these drugs:
| T40.1, T40.2, T40.3 | T40.4 | Other Categories [16] |
| Codeine | Alfentanyl | Loperamide T40.6 |
| Dihydrocodeine | Buprenorphrine | Noscapine, T48.3 |
| Hydrocodone | Butorphanol | Remifentanil [no reference] |
| Hydromorphone | Levorphanol | Tapentadol [reference] |
| Methadone | Meperidine | Hebaine [no reference] |
| Morphine* | Nalbuphine | |
| Oxycodone | Pentazocine | |
| Oxymorphone | Fentanyl when confirmed as prescribed* |
|
| Propoxyphene | ||
| Sufentanil | ||
| Tramadol |
Table 4: “Prescription Drugs”
Defined in the CDC State Unintentional Drug Overdose System [*]
Note * Morphine is a by-product of Heroin metabolism. Morphine is now coded as a “prescription” drug in SUDORS records only when the decedent is believed unlikely to have died from Heroin use.
The SUDORS dashboard for “prescription opioid deaths” in 2020 indicates somewhat higher mortality rates than reflected in Figure 7 and Table 3 above. Likewise, the ranked order of the top five States by prescription-opioid mortality rates also varies. These are expected results of the inclusion of additional drugs in the SUDORS definition of “prescription” drugs that are coded as T40.3 or T40.6 in Multiple Cause of Death databases.
Also of interest is the SUDORS dashboard display of “percentages of overdose deaths involving select drugs and classes” in 2020. Among 34 reporting jurisdictions, “prescription” opioids were noted in 8,948 deaths or 18.6% of all drug-related death reports nationally. Illegally made Fentanyl was noted in 33,677 deaths, or 68.8% of all reports.
There is a plausible overall explanation for these interacting and shifting trends. The US “opioid crisis” is not a single National phenomenon with a few readily obvious “causes”. It is instead a county-by-county amalgam of several contributing factors. These factors may include availability of pharmaceutical-grade drugs diverted from legitimate sources, operations by local illegal dealers supplied by US or Mexican drug cartels, and local rates of structural unemployment and family disintegration that impact individual vulnerability to the distractions of addicting drugs. [30]
Overlaps in Multiple Cause of Death Reports
A further CDC-Wonder data search from December 2023 also informs us concerning deaths in which multiple factors play a role. Table 5 is a listing of reports from the Multiple Cause of Death database for drug-related deaths where contributions are listed for sub-categories T40.2, T40.4, or both, for 2015 to 2020. In about ten to twelve percent of reports where one or the other of these two factors appears, both are registered.
| Year | T40.2 Reports | T40.4 Reports | T40.2 and/or T40.4 Reports | Overlap Factor |
| 2015 | 12,728 | 9,580 | 20,245 | 1.10 |
| 2016 | 14,487 | 19,413 | 30,247 | 1.12 |
| 2017 | 14,495 | 28,466 | 38,130 | 1.13 |
| 2018 | 12,552 | 31,335 | 39,190 | 1.12 |
| 2019 | 11,886 | 36,359 | 43,171 | 1.12 |
| 2020 | 13,472 | 56,518 | 62,610 | 1.12 |
Table 5: US-CDC Mortality Reports In Prescription-Drug-Related Categories,
2015 to 2020 [Data downloaded December 2023]
Trends for 2016-2020
CDC-Wonder data were also applied to track aggregated US National mortality reports involving drug-related drug poisonings from 2016 to 2020, focusing particularly on the two sub-categories most closely associated with prescription opioids. Results are shown in Table 5:
| 2016 | 2017 | 2018 | 2019 | 2020 | |
| Exponential Projection of Jalal et al Note 1. | 15.07 Reports/
100K |
16.22 Reports/ 100K
|
17.46
Reports/ 100K
|
18.9 Reports/ 100K
|
20.2 Reports/ 100K
|
| CDC -All Drug-Related Poisoning Note 2 | 20.8 Reports/
100K |
22.7 Reports/ 100K | 21.7 Reports/ 100K | 22.7 Reports/ 100K | 29.2 Reports/ 100K |
| CDC Prescription Drug-Related Poisoning T40.2, T40.3 Note 3 |
5.3 Reports/
100K |
5.2 Reports/ 100K | 4.6 Reports/ 100K | 4.3 Reports/ 100K | 5.0 Reports/ 100K |
Table 5: National Drug-Related Mortality 2016-2020,
Accessed December 2023 [Notes 1-3]
Note 1: Exponential curve of Jalal et al: Y = 10^(-.038 + 0.032 x (Year-1978) ) for all drug-related deaths.
Note 2: CDC Wonder Database, December 2023 — all underlying cause of death records classified as drug-induced causes. [25]
Note 3: CDC Wonder Database, December 2023 — all drug-overdose-related mortality reports in Sub-Categories T40.2 and T40.3. In 2016, recent CDC-Wonder reports of deaths where a prescription opioid may have contributed exceeded reports documented by Jalal et al (Figure 1) by 50%.
From 2016 to 2020, nationally aggregated death reports involving all drugs as contributors exceeded the exponential projection of Jalal et al. However, in 2017 to 2019, mortality reports for deaths due to all drugs or specifically involving prescription opioids as one factor appeared to “flatten” before continuing upward. The reasons behind this “pause” are presently uncertain.
From 2016 to 2020, reports of deaths where prescription opioids were one factor, comprised about 18 to 25% of all drug mortality reports. Thus, while it may be argued that drugs commonly prescribed by clinicians to their patients may have contributed marginally to our National opioid crisis, it may not be claimed that such prescribing “caused” the crisis or was dominant. Nor is a public health policy of restricting availability of such pain relievers likely to make an observable difference in rates of death due to illicit opioids that pain patients almost never use unless they are denied safe and effective pain care.[31]
OBSERVATIONS
- Reports of US National drug-overdose-related mortality of all types in the US followed an exponential curve between 1978 and 2016, with significant shifting between sub-category contributions. After 2016, the exponential curve under-estimates mortality due to drug overdose — in significant part because of an explosion in deaths involving to illicit Fentanyl, often dispensed as a contaminant in counterfeit pain pills.
- In a landmark paper published in 2018 by Hawre Jalal and his colleagues noted that drugs of unknown type and “other but unspecified” narcotic drugs varied between 20-25% of all US drug overdose reports. These categories are associated with County Coroner and Medical Examiner uncertainty in assignments of cause of death.
- Independently of Jalal et al, business analyst John Alan Tucker developed a dis-aggregated State by State analysis of drug-overdose-related mortality reports downloaded from the CDC in 2016. This analysis was further elaborated by Dr Tucker in collaboration with the principal author of the present paper, and summarized in an article published in 2018. The present paper employs the same framework of analysis for the period 2010-2020. The analysis supports the observation that there is no statistically meaningful cause-and-effect relationship between rates of opioid prescribing by clinicians to their patients versus risk of mortality involving prescription opioid analgesics. This is an expected observation in that there is no single “US opioid crisis.” What we have instead is an aggregate of many shifting county-by-county crises that respond to many interactive local factors. There is no easy single solution for these crises [31].
- The incidence of accidental deaths in which a prescription opioid may have contributed, rose between 2010 and 2016 and then fell from 2016 to 2020. Several States with higher mortality rates also had low prescribing rates and vice versa. Trend lines with prescription rates as the assumed independent variable were flat or declining. Correlation coefficients in de-aggregated State data are on the order of 0.02 or lower. A plausible conclusion from this reality is that the US now faces not one “national opioid crisis” but rather many “local and State opioid crises” in which many factors other than prescription opioids play significant roles. No “one size fits all” National policy on drugs will effectively address these crises. Restriction of opioid prescribing for people in pain has been demonstrably ineffective.
- Opioid prescribing dropped sharply from 2010 to 2020, in part as a consequence of the closure of pill mill operations that previously diverted large volumes of pharmaceutical grade opioids into street markets. As prescribing dropped, mortality involving Heroin or illicit Fentanyl and its analogs rose sharply. After a “pause” in 2011 to 2013, mortality rates involving prescription opioids again rose marginally, as National rates of mortality from all drugs rose more steeply.
- Revision of CDC methodology in 2018 significantly changed attribution of accidental drug-related mortalities between sub-categories within overall drug overdose mortality. Illegally manufactured Fentanyl distributed in counterfeit pain pills presently dominates opioid-overdose-related mortality in the US.
The conclusion to be drawn from the analysis of this paper is that there is no generalizable cause and effect relationship between rates of clinical prescribing of opioid analgesics, versus rates of mortality in which a prescription opioid is believed to be a contributor.
About the Authors:
Richard A Lawhern PhD is a technically trained non-clinician healthcare writer and patient advocate, with 26 years’ experience as a moderator in peer-to-peer social media support groups for patients and caregivers who deal with chronic severe pain. He has authored or co-authored over 200 papers and articles in a mix of peer-reviewed medical journals and mass media. He serves as an invited patient advocate on the editorial board of the journal Practical Pain Management.
Stephen E Nadeau MD is a behavioral neurologist with over 40 years’ clinical experience, much in treatment of pain. He is a member of faculty at the University of Florida College of Medicine, and a Staff Neurologist at the Malcom Randall Veterans Administration Medical Center. Positions expressed in this paper may not reflect those of the Veterans Administration, the United States Government, or the University of Florida.
Jay K. Joshi, MD is a practicing physician and entrepreneur in Northwest Indiana. He is also an advocate for physicians to ensure they receive proper due diligence in civil and criminal litigation. His book, Burden of Pain, identifies opioid health policies that can bridge the divide between the legal and clinical worlds. He regularly blogs on his website, Daily Remedy.
Dr Joshi and Dr Nadeau have cross-checked and validated the conclusions of this paper, based on their clinical observations and experience.
REFERENCES:
- Jay Joshi, MD, Richard A Lawhern, PhD, and Steven E Nadeau, MD, “Delving Deeper Into Opioid Mortality Statistics,” Daily Remedy, December 3, 2023, https://youtu.be/4qNuv6swyrs
- CDC Press Releases. CDC (2016). Available online at: https://www.cdc.gov/media/releases/2016/p0315-prescribing-opioids-guidelines.html
- Centers for Disease Control and Prevention. “CDC Guideline for Prescribing Opioids for Chronic Pain — United States, 2016” Recommendations and Reports / March 18, 2016 / 65(1);1–49 https://www.cdc.gov/mmwr/volumes/65/rr/rr6501e1.htm
- Centers for Disease Control and Prevention, “CDC Clinical Practice Guideline for Prescribing Opioids for Pain – United States, 2022” Recommendations and Reports / November 4, 2022 / 71(3);1–95 https://www.cdc.gov/mmwr/volumes/71/rr/rr7103a1.htm?s_cid=rr7103a1_w
- Cathleen London, MD, CIPP/US “DoJ Overreach: The Criminalization of Medicine” Journal of Legal Medicine, Vol 41, 2021, Issue 3-4, pp 192-203 https://doi.org/10.1080/01947648.2022.2147366
- Aubry L and Carr BT, “Overdose, opioid treatment admissions and prescription opioid pain reliever relationships: United States, 2010–2019” , Frontiers in Pain Medicine, Augusts 4, 2022, https://www.frontiersin.org/articles/10.3389/fpain.2022.884674/full
- Jalal H, Buchanach JM, Roberts MS, Balmert :C, Zhang K, and Burke DS, “Changing dynamics of the drug overdose epidemic in the United States from 1979 through 2016” Science, Vol 361, Issue 6408, 21 September 2018, https://www.science.org/doi/10.1126/science.aau1184
- John Alan Tucker, Unpublished Excel Workbook, February 2016.
- Richard A Lawhern, Ph.D and John Alan Tucker, PhD “Analysis of US Opioid Mortality and ER Visit Data”, PowerPoint Presentation, April 2018 http://face-facts.org/atip/
- Richard A. Lawhern, Ph.D., “Over Prescribing Did Not Cause America’s Opioid Crisis”, Blog of Dr Lynn Webster, Updated April 5, 2019 http://www.lynnwebstermd.com/over-prescribing/
- Richard A Lawhern, PhD. CDC-Wonder Search, December 10, 2023, https://wonder.cdc.gov/controller/datarequest/D77;sessionid=62F2DB453CBC69886CFD91445703Centers for Disease Control and Prevention, National Center for Health Statistics. National Vital Statistics System, Mortality 1999-2020 on CDC WONDER Online Database, released in 2021. Data from the Multiple Cause of Death Files, 1999-2020, as compiled from data provided by the 57 vital statistics jurisdictions through the Vital Statistics Cooperative Program. Accessed at http://wonder.cdc.gov/mcd-icd10.html on Dec 10, 2023.
- MCD – ICD-10 Codes: V01-Y89 (External causes of morbidity and mortality) Group by Year, X42 (Accidental poisoning by and exposure to narcotics and psychodysleptics [hallucinogens], not elsewhere classified); and Subcategories T40.2 and T40.4
- Larry Aubry, “Rate of National Drug Overdose Deaths” downloaded and organized by the National Institute on Drug Abuse, employing the CDC-Wonder Database, January 2023. File archived at https://view.officeapps.live.com/op/view.aspx?src=https%3A%2F%2Fnida.nih.gov%2Fsites%2Fdefault%2Ffiles%2FOverdose_data_1999-2021%25201.19.23.xlsx&wdOrigin=BROWSELINK
- Centers for Disease Control and Prevention, National Center for Health Statistics. “Multiple Cause of Death 1999-2017 on CDC WONDER Online Database,” current release at http://wonder.cdc.gov/mcd-icd10.html
- National Center for Health Statistics – “US Opioid Dispensing Rate Maps” accessed April 2019 and December 2023 https://www.cdc.gov/drugoverdose/rxrate-maps/index.html
- Department of Justice / Drug Enforcement Administration “Synthetic Opioids”, April 2020, https://www.dea.gov/sites/default/files/2020-06/Synthetic%20Opioids-2020.pdf
- US Centers for Disease Control and Prevention, “Instruction Manuals for ICD-10 Mortality 2e, Volume 3, 2015, https://www.cdc.gov/nchs/data/dvs/2e_volume3_2015.pdf
- US Centers for Disease Control and Prevention – National Vital Statistics System “Provisional Drug Overdose Death Counts”
- Evans WN, Lieber E, Power P, “How the Reformulation of Oxycontin Ignited the Heroin Epidemic”, National Bureau of Economic Research Working Paper 24475, April 2018, https://www.nber.org/papers/w24475
- O’Donnell J, Tanz LJ, et al, “Drug Overdose Deaths with Evidence of Counterfeit Pill Use — United States, July 2019–December 2021,” US Department of Health and Human Services / Centers for Disease Control and Prevention – Morbidity and Mortality Weekly ReportSeptember 1, 2023, Vol. 72, No. 35. https://www.cdc.gov/mmwr/volumes/72/wr/pdfs/mm7235a3-h.pdf
- Seth P, Rudd RA, Noonan RK, and Hagerich TM, “Quantifying the Epidemic of Prescription Opioid Overdose Deaths” American Journal of Public Health, 2018 April; 108(4): pp 500–502. doi: 2105/AJPH.2017.304265
- Brat, G, et al, “Postsurgical prescriptions for opioid naive patients and association with overdose and misuse: retrospective cohort study” British Medical Journal, 2018 http://www.bmj.com/content/360/bmj.j5790.long
- Oliva EM, Bowe T, and Tavakoli, et al, “Development and Applications of the Veterans Health Administration’s Stratification Tool for Opioid Risk Mitigation (STORM) to Improve Opioid Safety and Prevent Overdose and Suicide”. Department of Veterans Affairs, “Psychological Services” 2017, Vol 14, No 1, pp 34-49. Available for purchase through American Psychological Association, APA Psych Net, https://psycnet.apa.org/doiLanding?doi=10.037%2Fser0000099
- Bohnert ASB, Valenstein M, Bair MJ, Ganoczy D, McCarthy JF, Ilgen MA, et al. Association between opioid prescribing patterns and opioid overdose-related deaths. (2011) 305:1315–21. doi: 10.1001/jama.2011.370
- Sun EC, Darnall BD, Baker LC, Mackey S. “Incidence of and risk factors for chronic opioid use among opioid-naive patients in the postoperative period.” JAMA Intern Med 2016;176:1286–93. https://doi.org/10.1001/jamainternmed.2016.3298 PMID:27400458
- Centers for Disease Control and Prevention, National Center for Health Statistics. National Vital Statistics System, Mortality 1999-2020 on CDC WONDER Online Database, released in 2021. Data are from the Multiple Cause of Death Files, 1999-2020, as compiled from data provided by the 57 vital statistics jurisdictions through the Vital Statistics Cooperative Program. Accessed at http://wonder.cdc.gov/mcd-icd10.html on Dec 21, 2023
- US Centers for Disease Control and Prevention “Drug Overdose – Data Dashboards and Alerts”, accessed December 2023, https://www.cdc.gov/drugoverdose/fatal/dashboard/index.html
- Rutkow L, Vernick JS, Alexander GC. “More states should regulate pain management clinics to promote public health,” AJPH 107(2), 240–243 (2017)
- Compton WM, Jones CM, Baldwin GT. “Relationship between nonmedical prescription-opioid use and heroin use.” N Engl J Med. (2016) 374:154– 63. doi: 10.1056/NEJMra1508490
- The Heller School for Social Policy and Management “History of Prescription Monitoring Programs”, Brandeis University, MA , 2018
- Lawhern RA “One Opioid Epidemic or Many?” American Council on Science and Health, May 14, 2018. https://www.acsh.org/news/2018/05/14/one-opioid-crisis-or-many-12956
- Dasgupta N, Beletsky L, and Ciccarone D “Opioid Crisis: No Easy Fix for its Social and Economic Determinants”, American Journal of Public Health January 10, 2018.


Thank you Jay and Steve, for your participation in this important work.
One correction in Figure 2: These data are for 2010, not 2016.
We’ve known for a long time that there was no way to distinguish legal fentanyl from illegal fentanyl. Couldn’t the same be said for ALL opioid medications? Illegal Percocet, Vicodin, and others have been available in this country for years. Government agencies seem to concentrate on the diversion of prescription medications, but couldn’t a lot of ODs have been caused by people buying these drugs online or on the streets? Can they, and if so, how do they, differentiate between ANY legal and illegal opioid medications?
The DEA has recently been forced to admit that it can only trace about 1% of all manufactured opioids into diversionary channels. Presently over 80% of overdose-related deaths are (as you note) due to illegal fentanyl, mostly in counterfeit pain pills.
Kilos t is likely waiting for the death of more drug addicts to which he will then say that reduced opioid prescribing is the reason for reduction in opioid addiction and overdose
Gina, A friend bought what he thought was Oxycodone 30mg on the street. It was a white pill, which is what prescription Oxycodone looks like. It was not in fact Oxycodone, but Fentanyl. He OD’d and almost died. There is no legal Fentanyl that is a white pill. It comes in patches, lollipops, a lozenge or injection forms. This is distinctive of illegal Fentanyl, but at the same time I am proving your point that it is NOT diversion of prescription drugs causing the OD Crisis. Included in every Fentanyl prescription is the formula for Fentanyl. Doesn’t that make it easier for a chemist to produce it?
The chemical process for manufacturing Fentanyl is well known to illicit drug labs all over the world, Alice. The fact that pills sold in street markets are pressed to closely resemble legitimate pain medications also makes it harder for medical examiners to determine the source of what killed the decedent. The CDC’s new “State Unintentional Drug Overdose System” (SUDORS) is an effort to re-train coroners and medical examiners, and to impose more rigorous reporting requirements nationwide. Right now, only 30 or so States have met requirements to participate.